
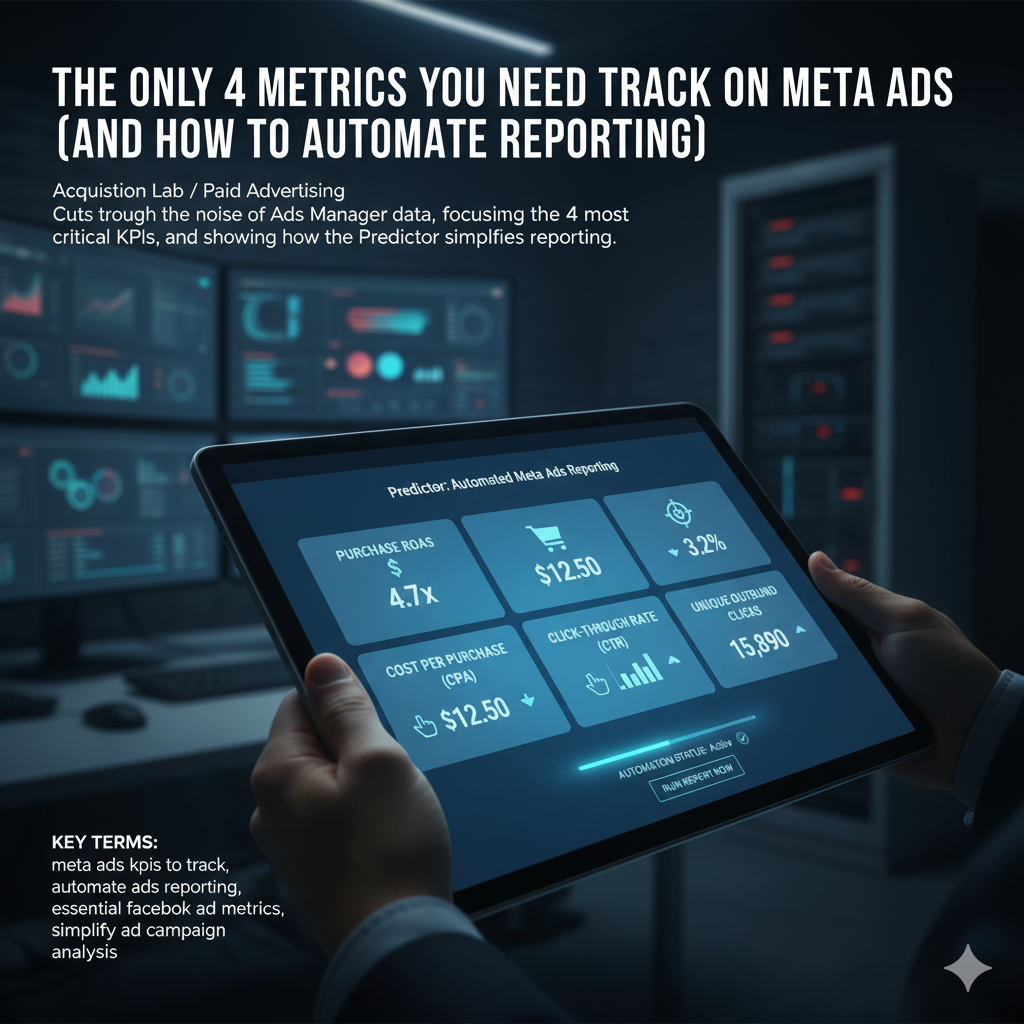
The Only 4 Metrics You Need to Track on Meta Ads (and How to Automate Reporting)
How to Automate Reporting
Logging into your Meta Ads Manager dashboard can feel like staring at a spreadsheet with a million columns. There are dozens of metrics to choose from—impressions, clicks, conversions, reach, relevance score, and more. For marketers, this data overload often leads to analysis paralysis, causing them to either miss crucial insights or spend hours on manual reporting, all while their ad spend spirals out of control.
You don’t need to track everything. In fact, a handful of essential Facebook ad metrics tell the entire story of your ad’s performance, from its initial appeal to its final profitability. By focusing on these core Key Performance Indicators (KPIs), you can cut through the noise, make smarter decisions, and unlock a more efficient and profitable ad account.
This guide will reveal the only four metrics you need to track on Meta Ads. More importantly, it will show you how to automate ads reporting so you can spend less time in spreadsheets and more time on strategy.
The Problem: Data Overload and Analysis Paralysis
The allure of a massive data dashboard is the promise of perfect insight. But for most marketers, it’s a time sink. Manually exporting data, building pivot tables, and creating reports is not only tedious but also inefficient. By the time the report is complete, the data is already old, and the opportunity to optimize has passed.
The solution isn’t to stare at more columns; it’s to simplify.
The 4 Critical KPIs That Tell the Whole Story
These four metrics cover the entire customer journey, from initial interest to final conversion. By mastering them, you get a complete and accurate picture of your ad account’s health.
KPI 1: Click-Through Rate (CTR) – Your Ad’s Appeal
What It Is: The percentage of people who see your ad and click on it. It’s calculated as (Clicks / Impressions) x 100.
Why It Matters: CTR is your top-of-funnel metric. It’s the first signal you get from your audience. A high CTR (e.g., above 1.5% for most ad types) tells you that your ad creative and copy are highly relevant and compelling. Your message is resonating with your audience, and they are motivated to learn more. A low CTR, however, is a clear warning sign that your creative is failing, and it’s time for a refresh.
KPI 2: Cost Per Click (CPC) – Your Efficiency Score
What It Is: How much you are paying, on average, for each click. It’s calculated as Ad Spend / Clicks.
Why It Matters: CPC is your efficiency metric. While CTR tells you that your ad is appealing, CPC tells you how expensive that appeal is. In an ad auction, a low CPC is a sign that Meta’s algorithm sees your ad as highly relevant and is rewarding you with cheaper clicks. A rising CPC might indicate that your audience is becoming saturated, your competition is getting fiercer, or that you are paying too much for your traffic. Tracking this metric allows you to maintain a profitable flow of visitors.
KPI 3: CPA & ROAS – Your Profitability Gauge
What It Is:
- Cost Per Acquisition (CPA): How much it costs to acquire a single customer or lead. It’s calculated as
Ad Spend / Conversions. - Return on Ad Spend (ROAS): The amount of revenue you are generating for every dollar you spend on ads. It’s calculated as
Revenue / Ad Spend.
Why They Matter: These are your bottom-line, profitability metrics. They answer the most important question in all of advertising: “Am I making money?” If your CPA is higher than your profit margin, you’re losing money on every single conversion. If your ROAS is below your target, your ad account is not sustainable. These metrics are the ultimate measure of success and the ones you should be checking every single day. This is the most crucial of all the meta ads kpis to track.
KPI 4: Frequency – Your Audience Health Monitor
What It Is: The average number of times a person in your audience has seen your ad.
Why It Matters: Frequency is a crucial metric for predicting future performance. When a campaign’s frequency gets too high (e.g., above 3), it’s a clear sign of ad fatigue. People are seeing your ad over and over again, and your CTR and ROAS will inevitably begin to decline as a result. A rising frequency is your early warning system, signaling that it’s time to rotate your creative, expand your audience, or pause your campaign to prevent diminishing returns.
The Solution: How Predictor Automates Reporting
Knowing which metrics to track is only half the battle. The other half is tracking them efficiently. Instead of spending hours in spreadsheets, the best solution is to use an automated system that gives you a clean, real-time view of your most important data.
A dashboard tool like Predictor solves the problem of manual reporting with three key features:
- Auto-Syncing: It automatically pulls all your ad data from Meta Ads into a single, centralized dashboard. You no longer have to export CSV files or build custom reports. The data is always live and always accurate, allowing you to simplify ad campaign analysis.
- Simplified View: Predictor presents only the four critical KPIs you need to track. By focusing your attention on CTR, CPC, CPA/ROAS, and Frequency, it eliminates the noise and prevents analysis paralysis. You can see at a glance exactly which campaigns are performing and which are not.
- Real-Time Alerts: Predictor’s automation capabilities allow you to set up smart alerts. You can get an immediate notification when a key metric goes above or below a certain threshold. For example, “Alert me if CPA goes above $25” or “Alert me if Frequency on this ad set goes above 4.0.” This enables proactive, instant optimization that is impossible with manual reporting.
By focusing on these four essential Facebook ad metrics and using a tool to automate ads reporting, you can reclaim your time, cut through the noise, and start making data-driven decisions that directly impact your bottom line.

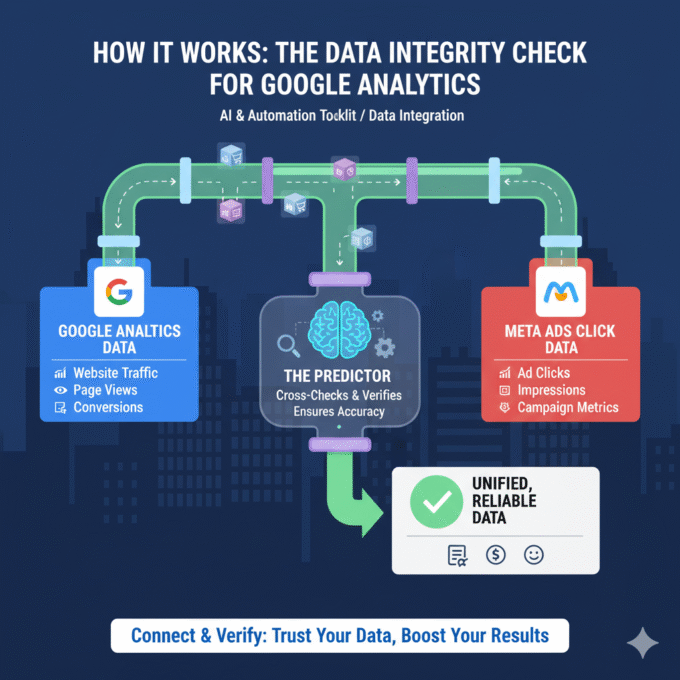
The Data Integrity Check for Google Analytics
How It Works: The Data Integrity Check for Google Analytics In the...
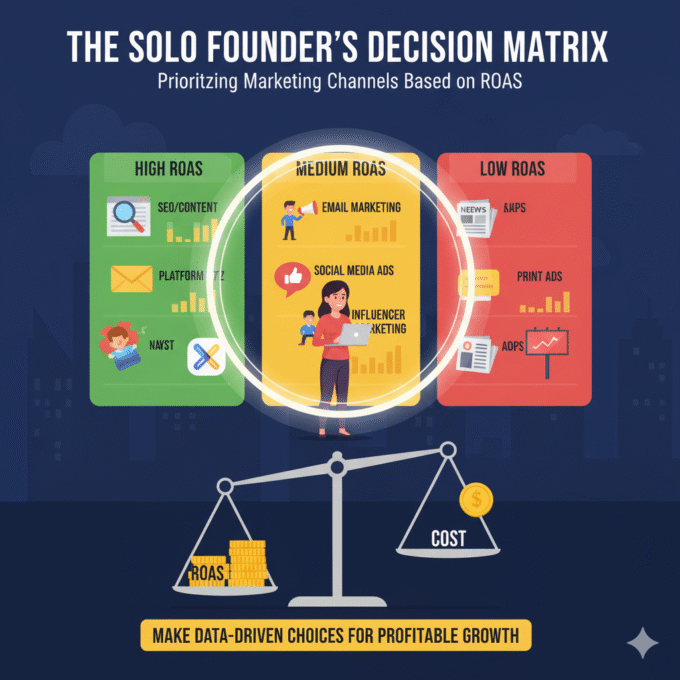
The Solo Founder’s Decision Matrix: Prioritizing Marketing Channels Based on ROAS
The Solo Founder’s Decision Matrix As a solo founder, your most precious...
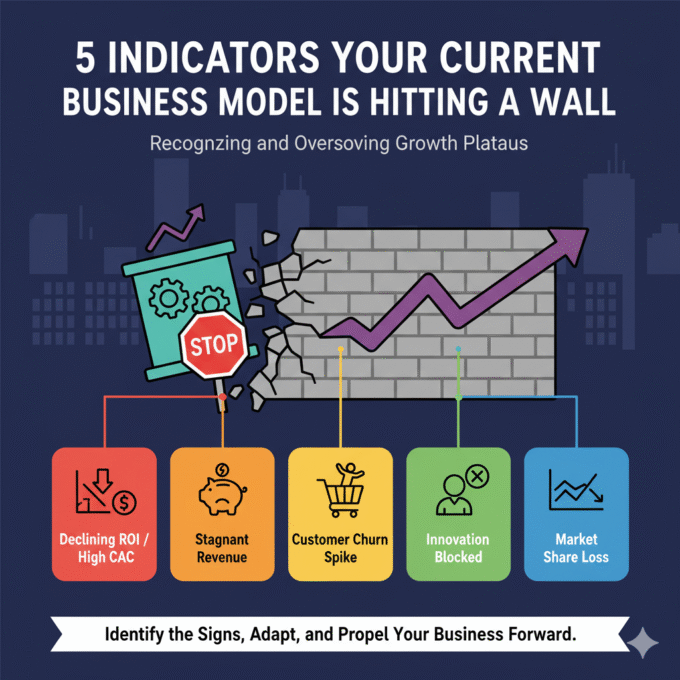
5 Indicators Your Current Business Model is Hitting a Wall
5 Indicators Your Current Business Model is Hitting a Wall The success...
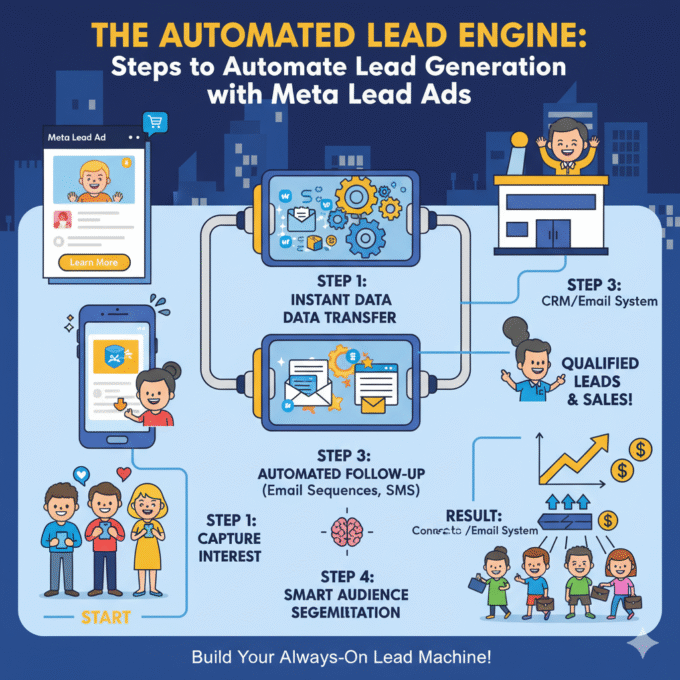
The Automated Lead Engine: Steps to Automate Lead Generation with Meta Lead Ads
Steps to Automate Lead Generation with Meta Lead Ads Meta Lead Ads...

META Andromeda update main secret
Creative as a Data Signal: How Meta’s Andromeda Update Rewrote the Rules...
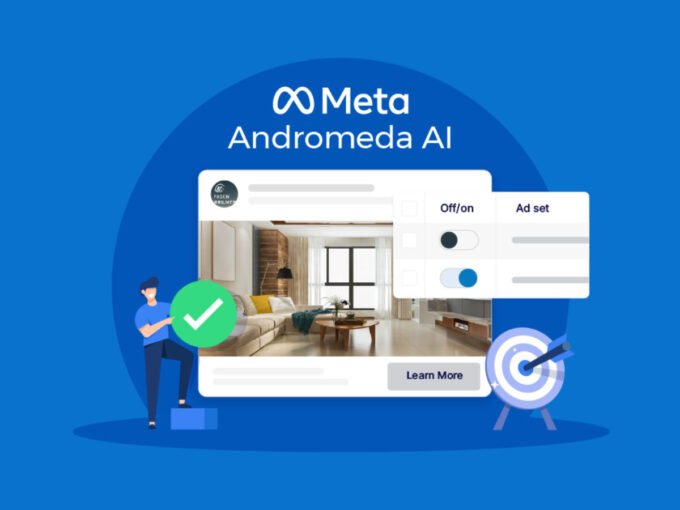
Meta Andromeda: The Next-Generation AI Engine for Performance Growth
I. Executive Summary: The Andromeda Paradigm Shift 1.1. Introduction to the AI...
The Data Integrity Check for Google Analytics
How It Works: The Data Integrity Check for Google Analytics In the...
The Solo Founder’s Decision Matrix: Prioritizing Marketing Channels Based on ROAS
The Solo Founder’s Decision Matrix As a solo founder, your most precious...
5 Indicators Your Current Business Model is Hitting a Wall
5 Indicators Your Current Business Model is Hitting a Wall The success...
The Automated Lead Engine: Steps to Automate Lead Generation with Meta Lead Ads
Steps to Automate Lead Generation with Meta Lead Ads Meta Lead Ads...